|
Image Properties |
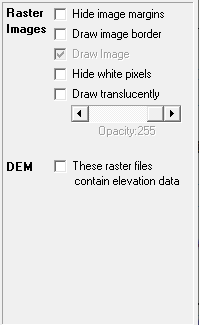
Hide Image Margins: Check this option to automatically hide any all white or all black margins. Such margins are found in some images that are not perfectly rectangular. This option is only supported on sid, tif, and ecw images.
Draw Image Border: Check this option to highlight the border of each image. This border will be drawn using the Line Properties for this layer.
Draw Image: Check the Draw Image Border option and Uncheck this option to see the image borders by themselves without the actual imagery.
Draw Translucent: This option allows users to view two or more imagery layers on top of each other. To do this, check this translucent option for the layer being drawn on top. This then causes the top layer to be drawn semi-transparently allowing viewers to see through it to the bottom layer.
Hide White Pixels: This option is designed for use with scanned drawings, plat sheets, or quad maps that typically consist of line work on a white background. When this option is checked, only the line work is displayed allowing users to see the other layers behind the image.
DEM
Think GIS supports digital elevation model data in the form of TIF images. Image files must be formatted such that each pixel is represented with a 32bit floating point value representing the elevation at that point. When this box is checked, Think GIS will use this elevation data in two ways. First the Get Elevation tool will use this data to display the elevation for any point picked on the map. Second, Think GIS can render a 3D looking relief map layer with optional contour lines based on the preferences defined by the three settings described below.
Shading Factor This controls how much contrast is used when shading the hills and valleys of the relief map. For flat parts of the country, choosing a higher shading factor to bring out even small changes in elevation would be advisable. But for more hilly parts of the country, try lower shading factor to keep from saturating the display in very steep areas.
Contour Interval In addition to displaying the relief shading, Think GIS can color alternating elevation intervals using different colors effectively creating contour lines. Specify here the elevation interval of these contours.
Color Count Specify here the number of colors to use for the contours. Specifying a value of 1 will not show any contours at all.
Notes:
•The "Draw Image Border" and "Draw Image" settings (introduced in Think GIS ver4.22) replaces the previous technique of using special line style settings to control this same feature.
•The "Hide Image Margins" setting (introduced in Think GIS ver4.22) replaces the need for the "ImageMargins" setting previously required in the layers Advanced Layer Settings.
•Images can also be auto labeled if desired.
•Think GIS supports the following types of images:
•MrSid images (Generation 2 & 3)
•TIFF images (including tiled tiff's)
•Jpeg2000 images
•ECW images
•Uncompressed 256 color BMP images
•Uncompressed black/white BMP images
|
Copyright © 2026 WTH Technology |