|
Illinois Farmland Assessment Setup |
Overview
The following describes how to setup a soils layer to work with the Illinois report format when using the Parcel Assessment Tool. The advanced layer settings of the Soils layer should have the following three sections:
1) A [Prod Factor] section defining the adjusted productivity indexes for each soil type. Unlike the Indiana productivity indexes, these are all whole numbers. See notes below for instructions on building this table. This table can potentially have up to 15,000 entries for all of Illinois so it would be best to build a separate table for each county, as needed, based on the counties unique soil id's.
2) An [EAV] section defining the Equalized Assessed Value for each productivity index. A list of these values for 2005 is included below which users can copy and paste into the soils layer. This table is optional. If left out then the report will just leave the last two columns blank. This table is much smaller than the Prod Factor table and should apply for all counties in Illinois.
See Land Use topic for other report specific requirements
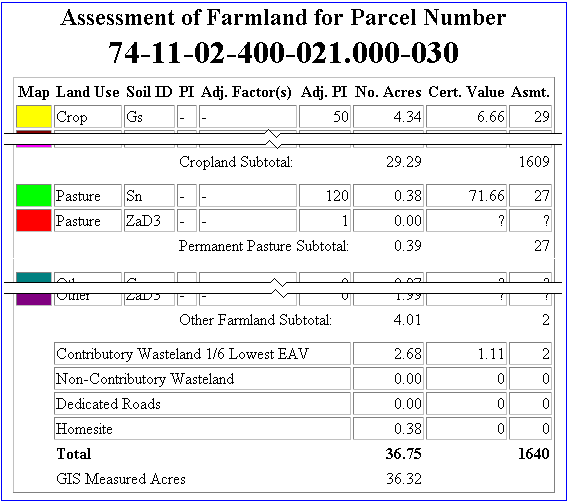
Example Output
Prod Factor table
A list of un-adjusted productivity indexes (PI's) can be found in the "Illinois Real Property Appraisal Manual" in the section titled "Rural Section - Assessment of Farmland" in "Table 2". This table lists the PI for all 1000 soil types in Illinois. Each soil id, however, can have an optional suffix which can alter the PI per "Table 3" in the same manual. The instructions below describe how to build a list of just those soil id's used by a county and then look up and sometimes calculate the adjusted PI for each soil. This is almost exactly the same process used in Indiana, however, it was often already done.
Step 1: build a list of unique soil id's used by a county.
There is a new tool on the report menu which lists the distinct field values for a layer. Run this tool on the soils layer to get a text file list of every unique soil id.
Step 2: Lookup un-adjusted PI
Each soil id (ie. "471B2") will consist of a numeric portion followed by an optional letter, followed by an optional number. The numeric portion is the soil number, the Letter is a slope indicator and the number after the letter is an erosion indicator.
For each soil id in the text file first lookup the soil number in Table 2. If there is no letter in the soil id or if it has the letter 'A', then the process is finished. Just record the raw PI number into the text file after the soil id separated by an equals sign (ie. "471=30") and then repeat step 2 for the next soil id. If there is a Letter other than A after the soil number then proceed to step 3.
Step 3: Determine the slope of the soil
Convert the letter following the soil number to a slope using the following table
B 4%
C 6%
D 10%
E 16%
F 26%
Step 4: Determine the amount of erosion
Use the optional number that follows the letter in the soil id along with the table below to determine the amount of erosion.
No number un-eroded
1 un-eroded
2 moderate erosion
3 severe erosion
Step 5: Determine if the subsoil is favorable
If there is an asterisk next to the soil number in Table 2 then the subsoil is "unfavorable"
Step 6: Lookup Erosion Adjustment factor
Using the 3 values determined in steps 3,4 & 5 Lookup the adjustment factor in Table 3 and multiply this percentage times the raw PI looked up in step 2 above. Record the this resulting value into the text file after the soil id separated by an equals sign (ie. "471B2=29") and then repeat from step 2 for the next soil id.
Example: Soil ID is "277C2"
Step 2: Using Table 2 the PI for soil 277 is 120
Step 3: "C" indicates a slope of 6%
Step 4: "2" indicates "moderate erosion"
Step 5: Soil number 277 has favorable subsoil because there is no asterisk next to it in table 2
Step 6: The adjustment factor in Table 3 for 6%, moderate erosion, favorable subsoil is 93. Therefore the adjusted PI is 120 X 0.93 = 112. So my text file records "277C2=112".
EAV Table
The following values are for 2005
[EAV]
60=7.89
61=8.60
62=9.32
63=10.01
64=10.76
65=11.47
66=12.23
67=12.96
68=13.73
69=14.48
70=15.17
71=15.84
72=18.73
73=21.63
74=24.50
75=27.39
76=30.28
77=33.17
78=36.05
79=38.93
80=41.81
81=44.70
82=47.58
83=50.45
84=53.36
85=56.23
86=59.11
87=63.14
88=67.73
89=72.32
90=77.03
91=81.82
92=86.62
93=91.29
94=94.99
95=98.74
96=102.52
97=106.34
98=110.01
99=113.28
100=116.58
101=119.92
102=123.28
103=127.48
104=132.17
105=136.94
106=141.74
107=146.61
108=151.54
109=156.51
110=161.55
111=166.64
112=171.79
113=176.99
114=182.25
115=187.57
116=192.93
117=198.36
118=203.93
119=209.37
120=214.97
121=220.61
122=226.31
123=232.07
124=237.88
125=243.76
126=249.68
127=255.65
128=261.70
129=267.79
130=273.94
|
Copyright © 2026 WTH Technology |