|
Feature Classification |
Feature Classification is a technique where users can draw different features with different display attributes based on the field values of the individual features. Up to 200 unique values per display attribute may be classified. The following display attributes can be classified:
•Line Color
•Line Width
•Line Style
•Text Color
•Fill Color
•Hatching
•Symbols
Classify by Unique Values:
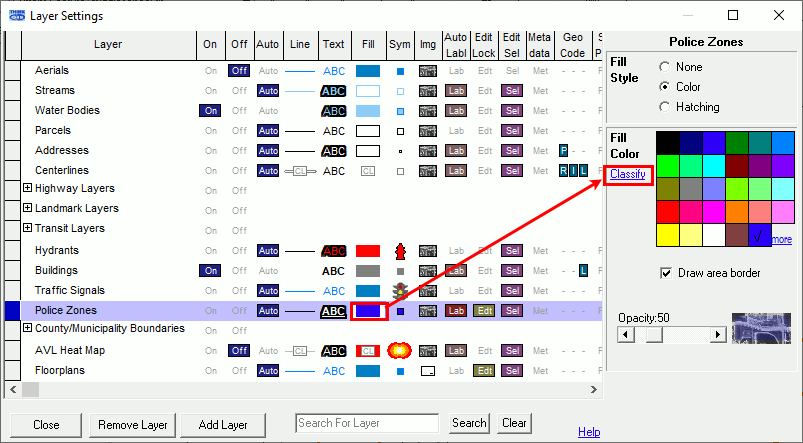
1) As in setting any layer attribute in the Layer Settings, first select the layer and the entity type in the Layer Settings window. In the entity type window (In this example, the fill column.), click "Classify."
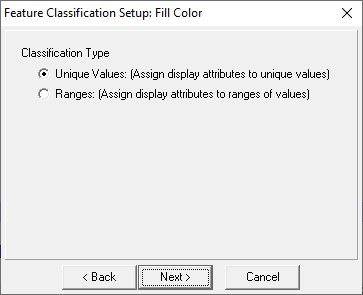
2) Keeping the Unique Values option checked, click Next.
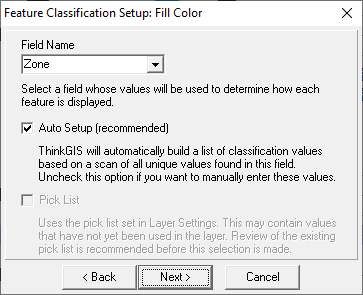
3) In the pull-down, select the field with unique vales to be used to classify the colors.
If the field selected has a pick list, the new Pick List option is exposed and may be selected:
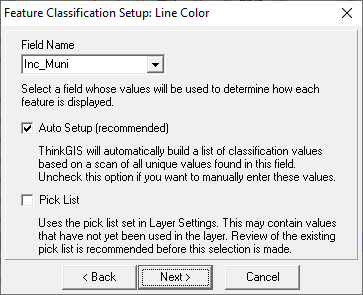
If it does not, it remains grayed out:
4) Think GIS will automatically assign colors to each feature in the layer.
.png)
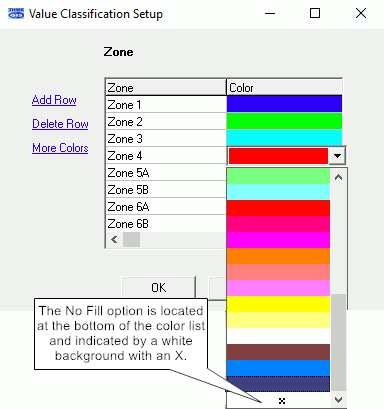
5) To change a color of features, click inside of the Fill Color Feature Form and it will expand in a pop-up window. Select the color of the feature(s) to change and select a new color from the pull-down menu, then click OK.
6) The layer will now display with these color values.
.png)
Classify by Ranges:
Feature Classification with ranges values is an option for applying colors to features based on numeric values fielded within the layer. This will create a visual representation of those values allowing the user to quickly identify a specific feature without needing to query in the Index or by clicking on a feature.
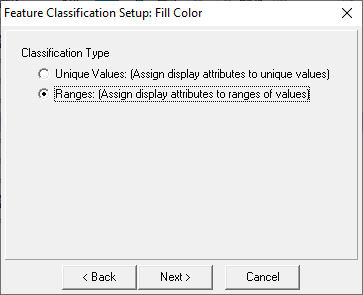
1) After selecting the layer and clicking on "Classify," select the "Ranges: (Assign display attributes to ranges of values)." Click "Next."
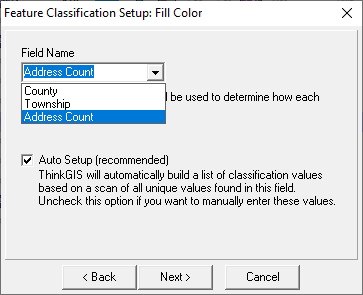
2) In the pull-down, select the field with unique, numeric vales to be used to classify the colors. Click "Next."
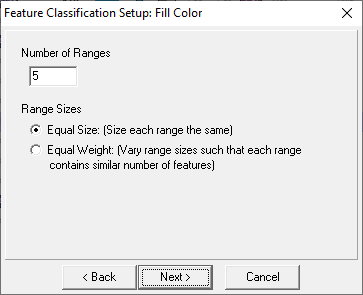
3) Set the number of ranges to be used. The higher the number, the more color ranges used to represent values. Click "Next."
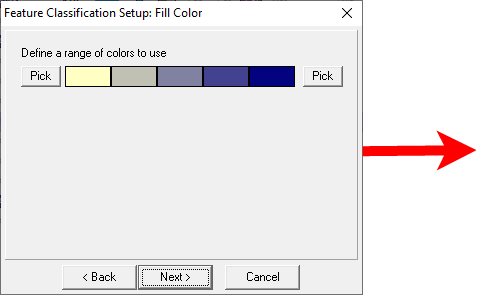
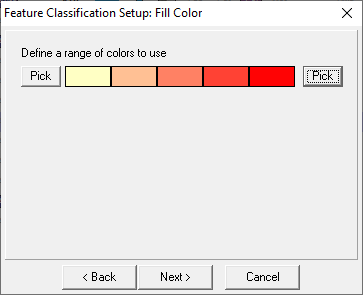
4) Clicking on the Pick button on either end of the spectrum will pull up a color pallet and allow user to select a new color for that end of the spectrum. Click "Next."
5) The ranges will display in the selected entity type.
.png)
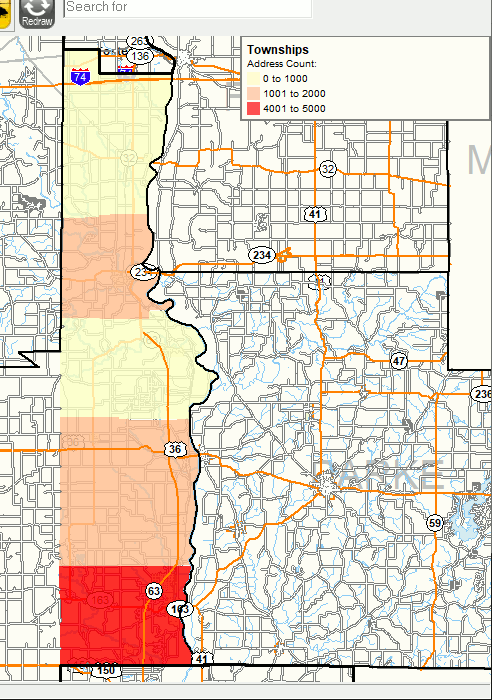
6) The map will display the layer using these color ranges.
How to edit classifications
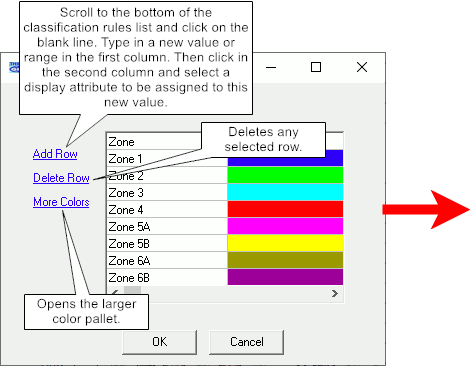
Add: Click in the classification configuration window on the right side of the Layer Settings window to open configuration pop-up window, and then click "Add Row" on the left side of the window. Add feature name to the feature column and click the classification column and select desired classification type.
Change: Click in the classification configuration window on the right side of the Layer Settings window to open configuration pop-up window, and then click in the appropriate cell of the list to change either the feature value or the classification value.
Delete: Click in the classification configuration window on the right side of the Layer Settings window to open configuration pop-up window, click on a cell in the row to be removed, and then click "Delete Row" on the left side of the window.
Unclassify: Click the "Un-classify" button to return to the basic mode of assigning a common attribute to the entire layer.
Reclassify: Use this button to re-setup classification for this attribute. Starting in version 4.32, clicking reclassify will remember the attributes assigned to each classification entry and re-use them in the new classification list if those values are still present in the layer.
More Colors: Opens the larger color pallet.
Draw Area Border: Checking this box will create a visible border around area entities. The border color will be defined by the Line Color of that layer.
Show Legend On Screen: Check this box to see a legend on the main Think GIS display showing these classification values. This option is completely independent of the legend displayed on printouts.
Notes:
•Any features that do not match any of the classification rules in the list will be assigned the default attribute for that layer. For example, if there is a 45deg hatch pattern assigned to this entire layer before turning classifications on then the 45deg hatch pattern will be used by default to draw any features that do not match any of the classification rules defined.
oLine Color, Text Color, and Fill Color are exceptions to this rule. Any features not matching any color classification rules will be assigned an arbitrary color based on the value in the classification field. Even though this default assignment of colors is somewhat random, users can be assured that any features having the same field value will be given the same color.
•Classified values may have up to 85 characters.
•Up to 200 unique values per display attribute may be classified. When that limit is reached, an error message is displayed.
•Match Line Color: This option is only displayed when classifying text color, or fill color and where the line color has also been classified. This allows users to color text or fill using the same rules already setup under line color.
•Pick List values that are not yet used in a map feature will still be assigned a classification value..
|
Copyright © 2026 WTH Technology |