|
Heat Map Image |
The Heat Map Image tool, found on the History Tab, creates an image file showing all vehicle activity for a select area of the map over a select time period.
To use this tool do the following:
1) Select the Heat Map Report button on the AVL Administrator History tab.

2) Select date and time parameters.
Click on the interactive image below for more information.
3) Select one or more vehicles to query.
Click on the interactive image below for more information.
4) Configure report parameters.
Click on the interactive image below for more information.
5) Click OK on the next pop-up message.
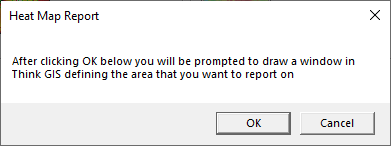
6) Think GIS will move to the front of the AVL Administrator. Left click and hold at a corner of the area to be queried, drag a box over the area to be covered, and then release the mouse button.
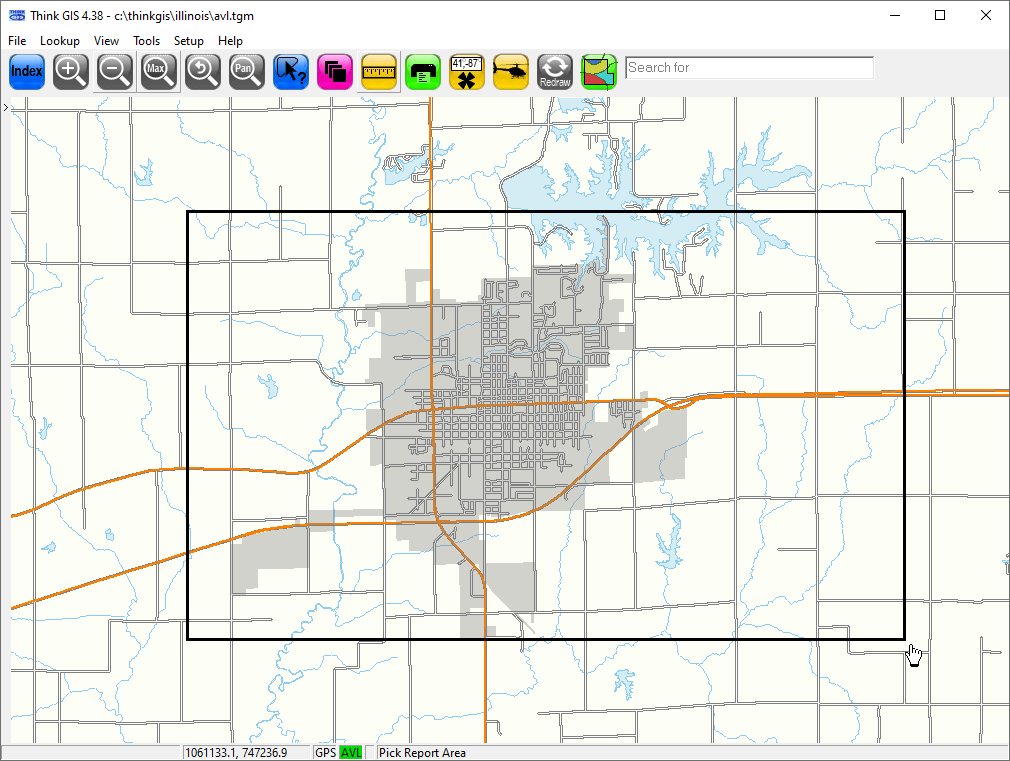
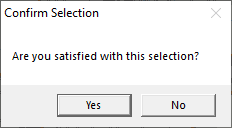
7) Select either Yes or No on the next pop-up window.
8) After the query has been processed, the resultant image will contain a map with a heat map.
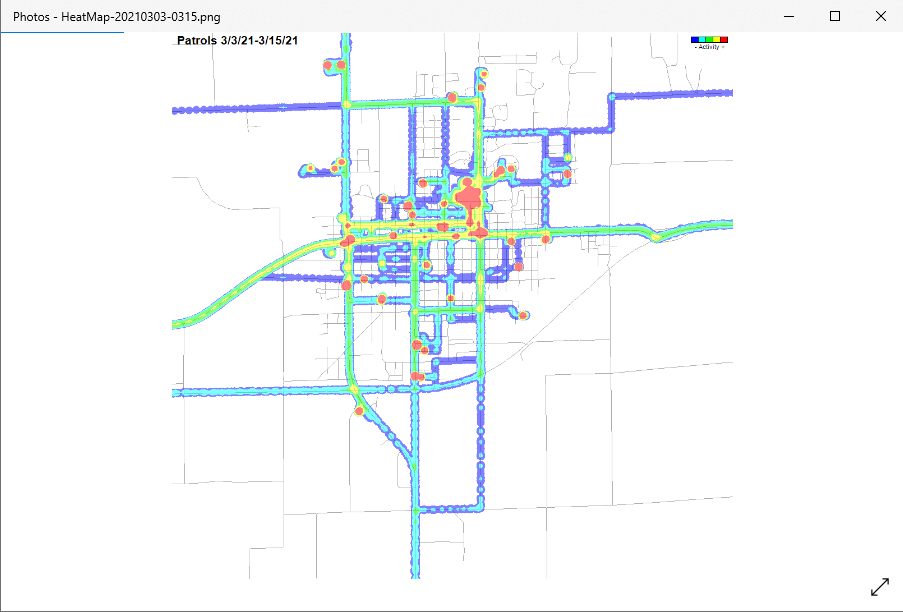
Notes:
•Heat Map Layer vs Heat Map Image: The Heat Map Layer downloads the data for the report from the server and dynamically renders it on the Think GIS display at any zoom level. The Heat Map Image report, however, generates its report on the server and a resulting static image is downloaded. The Layer option is best for interacting with the data and viewing it at varying zoom levels. The Image option is best if working with large amounts of historic data that take a lot of time or memory to download.
|
Copyright © 2025 |